Transmission Electron Microscopy, or TEM, is one of the most powerful techniques used to study materials at the nanoscale. In high-resolution TEM images, researchers often observe fine parallel bright and dark lines inside crystalline particles. These lines are commonly known as lattice fringes.
For students and researchers working with nanomaterials, catalysts, oxides, carbon materials, metals, ceramics, thin films, or other crystalline materials, understanding lattice fringes and d-spacing is very important for proper TEM result interpretation.
What are lattice fringes in TEM?
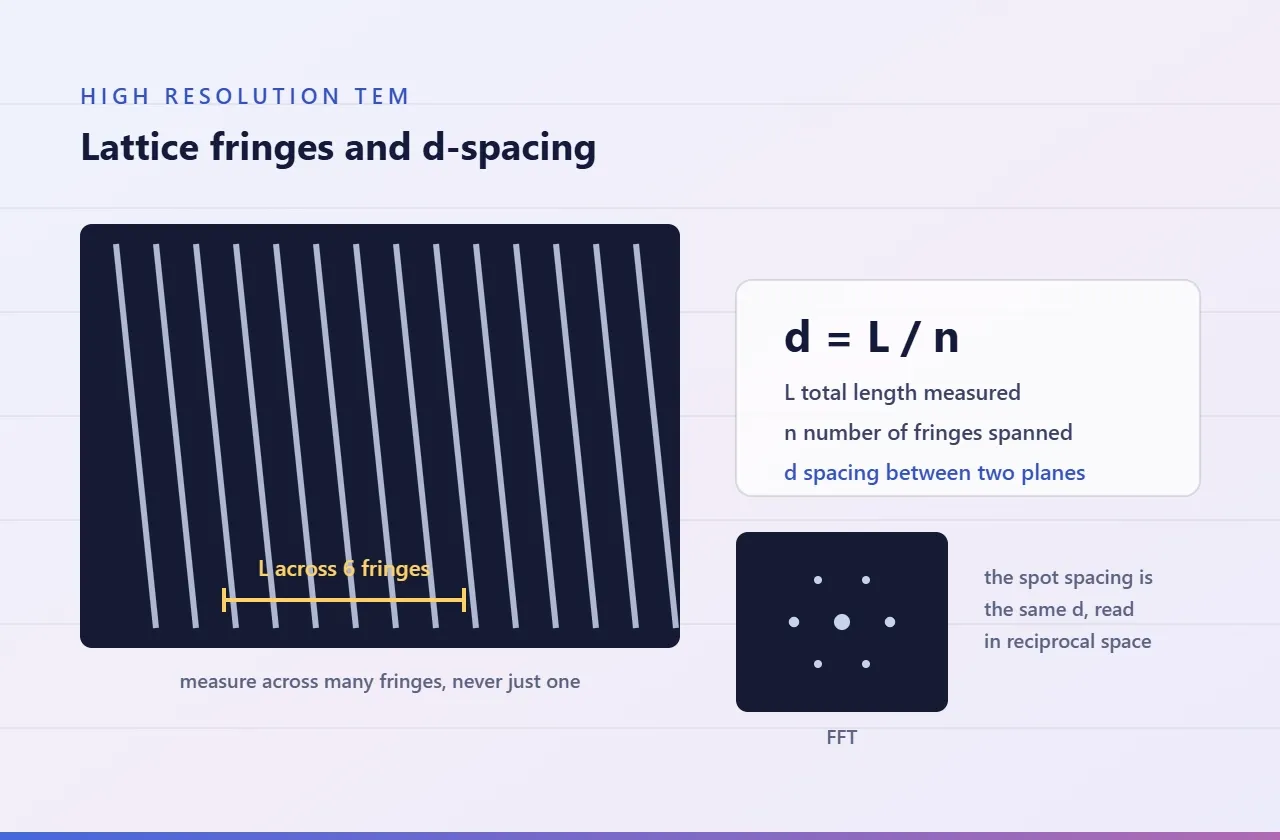
Lattice fringes are the bright and dark parallel lines seen in high-resolution TEM images of crystalline materials.
These fringes appear because the electron beam interacts with the regularly arranged atomic planes inside the crystal. When atoms are arranged in an ordered crystalline structure, TEM can show this periodic arrangement as repeating lines or fringes.
In simple words:
Lattice fringes show the ordered arrangement of atomic planes in a crystalline material.
If clear lattice fringes are visible in an HRTEM image, it usually indicates that the selected region of the sample is crystalline.
What is d-spacing?
d-spacing is the distance between two adjacent lattice fringes or atomic planes.
It is usually reported in:
nm or Å
For example:
0.24 nm = 2.4 Å
In TEM analysis, d-spacing is measured from the lattice fringes visible in the HRTEM image. This measured value can then be compared with XRD data, JCPDS/reference data, or literature values to identify the corresponding crystal plane.
For example, a d-spacing value may correspond to planes such as:
(111), (002), (101), (220)
The exact plane depends on the material and crystal structure.
Why is d-spacing important?
d-spacing is useful because it helps researchers connect TEM observations with crystallographic information.
It can help in:
identifying crystal planes
confirming crystalline phase
comparing TEM results with XRD
supporting material identification
understanding crystallinity
confirming lattice structure
strengthening thesis or publication results
For example, if XRD shows a specific phase and HRTEM d-spacing also matches the expected lattice plane of that phase, the result becomes more reliable.
How to calculate d-spacing from a TEM image?
The simplest method is direct measurement from the HRTEM image.
The formula is:
d-spacing = total measured distance / number of fringe gaps
Instead of measuring the distance between only two nearby fringes, it is better to measure across multiple fringes and then divide by the number of gaps.
This reduces error and gives a more accurate value.
Example calculation
Suppose you measure the distance across 10 lattice gaps in an HRTEM image.
Total measured distance = 2.4 nm
Number of fringe gaps = 10
So:
d-spacing = 2.4 / 10
d-spacing = 0.24 nm
This means the distance between two adjacent lattice planes is 0.24 nm.
This value can then be compared with XRD or reference data to identify the possible crystal plane.
Why should we measure across multiple fringes?
Measuring only one fringe gap can give error because of image noise, contrast variation, calibration error, or slight distortion in the TEM image.
That is why it is better to measure across 5–10 lattice spacings and calculate the average d-spacing.
This gives better accuracy and improves confidence in the result.
Lattice fringes vs d-spacing: simple difference
Lattice fringes are the visible parallel lines in the HRTEM image.
d-spacing is the measured distance between those parallel lines.
In simple words:
Lattice fringes show the crystalline arrangement, and d-spacing helps identify the crystal plane.
Important points while interpreting d-spacing
While calculating d-spacing from TEM images, keep these points in mind:
The TEM image should be properly calibrated.
The scale bar should be accurate.
Lattice fringes should be clear and visible.
Measure across multiple fringes, not only one gap.
Compare the measured d-spacing with XRD, JCPDS, or literature data.
Do not assign a crystal plane only from TEM without checking reference values.
For better confirmation, combine HRTEM, SAED, XRD, and other characterization results.
Where is d-spacing used?
d-spacing analysis is commonly used in research related to:
nanoparticles
metal oxides
carbon materials
catalysts
ceramics
quantum dots
battery materials
thin films
nanocomposites
crystalline polymers
semiconductor materials
It is especially useful when researchers want to confirm whether a synthesized material has the expected crystalline phase or lattice structure.
Final takeaway
Lattice fringes and d-spacing are important parts of HRTEM interpretation.
Lattice fringes indicate the presence of crystalline regions in the sample, while d-spacing gives quantitative information about the distance between atomic planes.
By comparing the measured d-spacing with reference data, researchers can identify crystal planes and support phase confirmation.
For students and researchers, understanding this concept is very helpful while interpreting TEM images, writing thesis results, preparing research papers, and comparing TEM data with XRD results.
In short: lattice fringes show crystallinity, and d-spacing helps identify the crystal plane.